
What Should a Manufacturing Dashboard Show? A Guide for Small Manufacturers
A good manufacturing dashboard is not the one with the most charts. It is the one that answers the questions a plant asks every day. This guide covers the core metrics, who should see which view, and what to leave off.
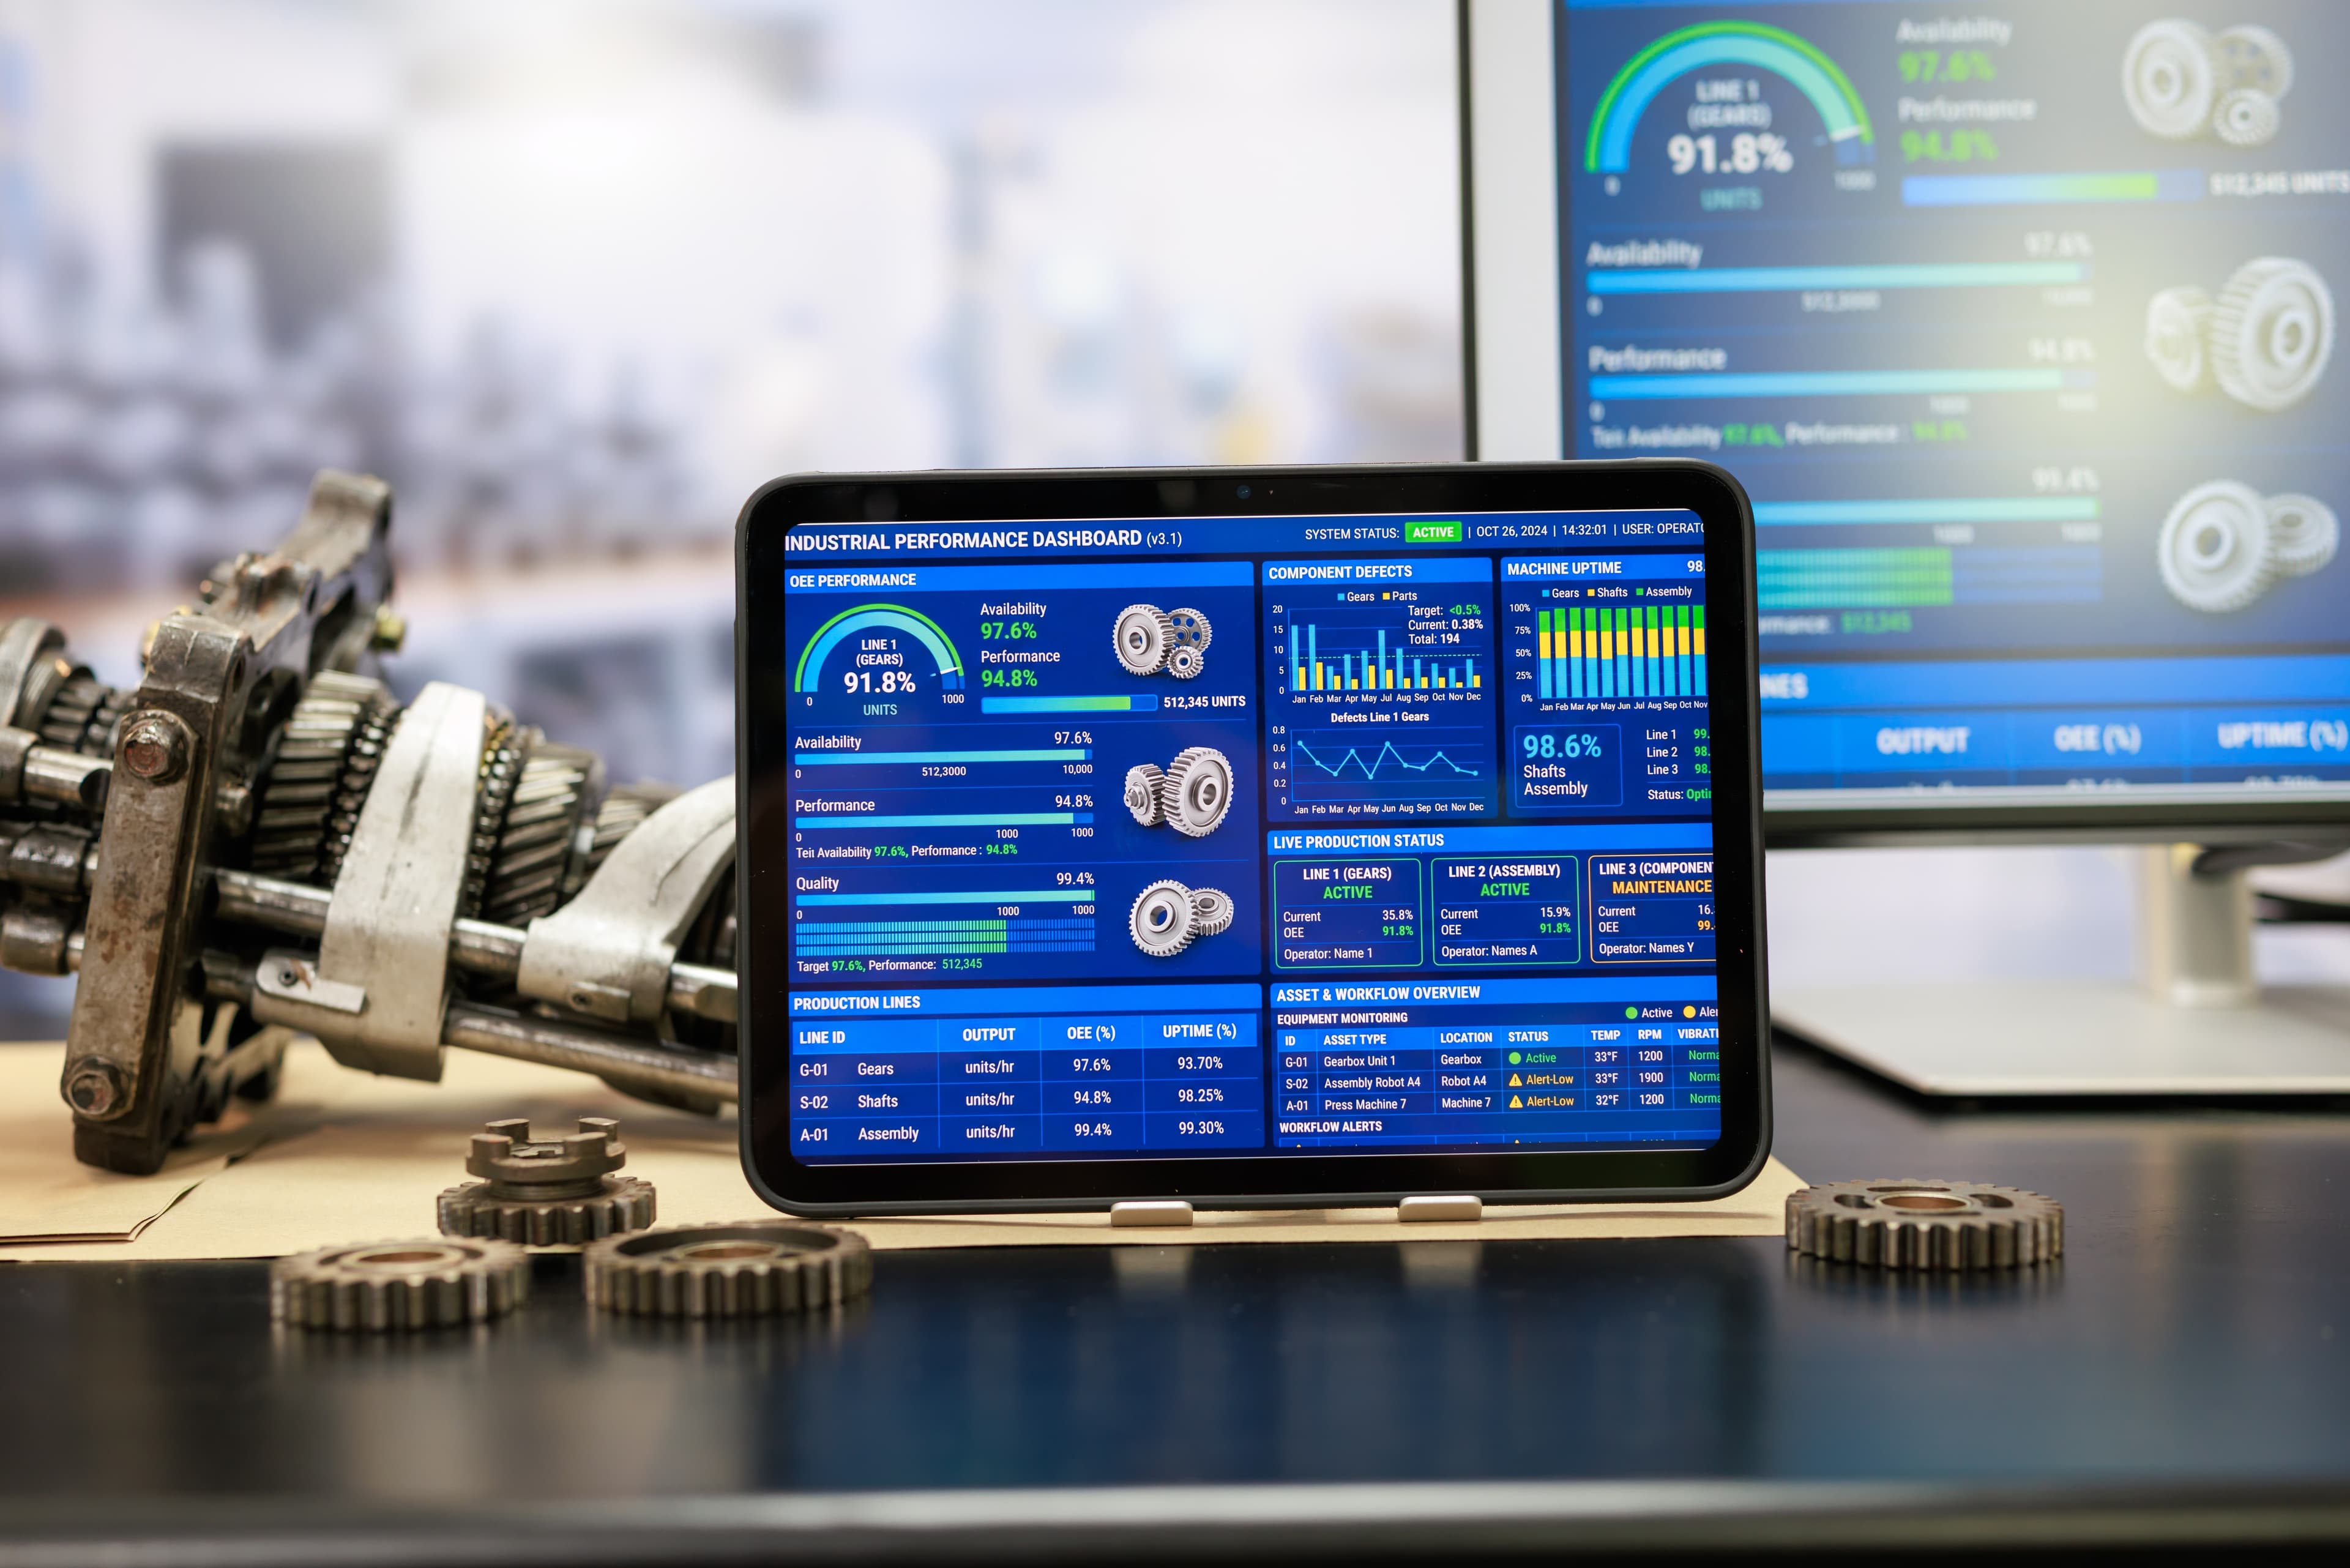
Quick answer: A manufacturing dashboard for a small manufacturer should show a short list of numbers that drive daily decisions: output against plan, open orders and their status, on time delivery, downtime, quality issues, inventory levels, and maintenance requests. Different roles need different views. An operator needs the current job, a supervisor needs the shift, and an owner needs the week. Most dashboards fail because they show too much, not too little.
When a plant decides it wants a dashboard, the first instinct is to list every number the business has. It feels thorough. In practice it produces a screen nobody looks at, because the one number that matters on a given morning is buried among thirty others.
A better approach is to start from the questions people ask every day and work backward to the data. This guide walks through the metrics most small manufacturers need, who should see what, and the things worth leaving off.
Start with questions, not metrics
A dashboard earns its place by answering a question faster than someone could find the answer otherwise. So before choosing a chart, write down the questions your people ask. Which orders are late? Is that machine running? Do we have the material for tomorrow? Where did the scrap come from?
If a number does not help answer a question that someone asks regularly, it probably does not belong on the first screen.
The core metrics for most small plants
| Metric | The question it answers | Who uses it |
|---|---|---|
| Output against plan | Are we on track for today and this week? | Supervisors and plant manager |
| Open orders and status | Where does each order stand and what is late? | Planners, sales, and management |
| On time delivery | Are we keeping the promises we made to customers? | Management and sales |
| Downtime | Which equipment stopped, for how long, and why? | Maintenance and supervisors |
| Quality and scrap | What is being rejected or reworked, and where? | Quality and supervisors |
| Inventory and material | Do we have what the next jobs need? | Planners and purchasing |
| Maintenance requests | What is open, assigned, and overdue? | Maintenance and plant manager |
You do not need all of these on day one. Most plants start with the three or four that cost them the most time and add the rest as the data becomes reliable.
A note on OEE
You will often hear about overall equipment effectiveness, or OEE. It combines three factors for a machine or line: availability, performance, and quality. Availability is how much of the planned time the equipment actually ran. Performance is how close it ran to its ideal speed. Quality is the share of output that was good the first time. Multiplied together, they give a single score.
It is a useful measure, but it depends on collecting clean data about run time, speed, and rejects. For a plant still using paper or spreadsheets, a simpler starting point is often better: track downtime and its reasons first, and add OEE once that data is trustworthy.
Different roles need different views
- Operators need the current job, what is next, and a simple way to log a problem. Fewer numbers, larger text.
- Supervisors need the shift: output against plan, machines down, and open issues.
- Planners and purchasing need orders, material, and what is at risk.
- The plant manager needs the day and the week: delivery, downtime, quality, and trends.
- The owner needs the short version: a handful of numbers that show whether the business is healthy, plus the ability to look deeper when something is off.
This is one reason off the shelf tools can fall short for some plants. Role based views are possible, but they get harder to maintain as the roles become more specific. We cover that tradeoff in our guide on choosing between a custom dashboard and an off the shelf tool.
What to leave off the screen
- Numbers nobody acts on. If a figure has never changed a decision, it is decoration.
- Anything that needs a manual export to stay current. A dashboard with stale data is worse than no dashboard, because people stop trusting it.
- Too many colors and alerts. If everything is flagged red, nothing stands out.
- Metrics nobody owns. Each number should have a person responsible for what happens when it moves.
Where the data comes from matters more than the charts
The Q1 2026 State of Digital Manufacturing Report from Lasso Supply Chain found that 46 percent of small and midsized manufacturers rate their use of data and analytics as manual or basic. If that describes your plant, the first job is not designing screens. It is getting the numbers into one place so they are accurate and current without someone retyping them.
That often means connecting orders, inventory, and equipment data, including older machines. Our guide on integrating legacy equipment with modern software covers how that can work, and the post on the signs you need an operations system explains when a dashboard is part of a larger fix.
How to start
Pick one area, such as late orders or downtime, and build a view that answers the questions in that area well. Use it for a few weeks. Ask the people who use it what is missing and what is noise. Then expand. A small dashboard that people check every morning is worth more than a large one that nobody opens.
You can see how we approach this on our custom dashboards page and our page for manufacturers.
Talk Through a Dashboard for Your Plant
A 20 to 30 minute discovery call is enough to agree which numbers belong on the first screen. IMANT Group builds custom dashboards for manufacturing, industrial, and healthcare businesses in Charlotte, NC and across the US.
Call (704) 686-8449 or email info@imantgroup.com, or schedule a consultation.
Frequently Asked Questions, Manufacturing Dashboards
What should a manufacturing dashboard show?
A short list of numbers that drive daily decisions: output against plan, open orders and status, on time delivery, downtime, quality issues, inventory, and maintenance requests. Which ones come first depends on what costs your plant the most time.
What is OEE?
Overall equipment effectiveness combines availability, performance, and quality into one score for a machine or line. It is useful once you collect clean data about run time, speed, and rejects.
How many metrics should a dashboard have?
Fewer than most people expect. A first screen with three to seven numbers that people act on is usually better than a crowded one. Detail can sit one click deeper.
Can a dashboard work with older equipment?
Often yes. Older machines can usually share data through a connection layer or by logging events at the machine, depending on what the equipment supports. We check this during scoping.
Do different people need different dashboards?
Usually they need different views of the same data. An operator, a supervisor, and an owner ask different questions, so each should see a screen built for those questions.